MPS Review of 2017 & Outlook for 2018
A look back at the highs and lows of 2017, and a look forward to what 2018 is likely to bring.
As we entered 2017 we held firm in our belief that the background for equities was generally positive and that the rise in equity markets following Trump’s election was likely to continue for some time.
This stance was driven by potential tax reforms and infrastructure spending in the US that could lead to higher growth and inflation. In such an environment we found it difficult to get enthused about the prospects for fixed income, particularly UK gilts. However our overweight to equities was achieved by having significant weightings to a couple of low beta funds (Janus Henderson UK Absolute Return and RWC Enhanced Income) to control risk within the portfolios. Interestingly UK gilts were historically volatile and we expect this to continue in 2018. Our biggest concern was the various political hurdles in the Eurozone where the election timetable posed a number of opportunities for existential risks to the euro.
It would be fair to say that we did not expect the rally in equities to continue uninterrupted throughout the entire year as it did. This meant however that there were very few reasons to make significant changes to the asset allocation in our portfolios and turnover was relatively low; only three rebalances were conducted over the twelve months.
It was pleasing to see all six of the portfolios outperform not only their respective benchmark but also their most relevant IA sector. The outperformance increased as we went up the risk profile in the range, primarily due to the strong relative performance of a number of our equity holdings. This was most noticeable in our UK list which saw a pleasing return to form for several of our active managers with a value or growth bias after a relatively tough (but still positive) 2016.
Over the year Man GLG Undervalued Assets and Artemis Select rose by 30.4% and 21.3% respectively compared to just 13.1% for the FTSE All-Share. Blackrock Smaller Companies Trust was the top performer in the UK list rising by 38.3%, with strong NAV performance being supplemented by its discount to NAV narrowing as well. Unsurprisingly, in such an environment, our income managers lagged significantly over the year and we took the opportunity to top up our exposure to Mark Barnett at Invesco Perpetual.
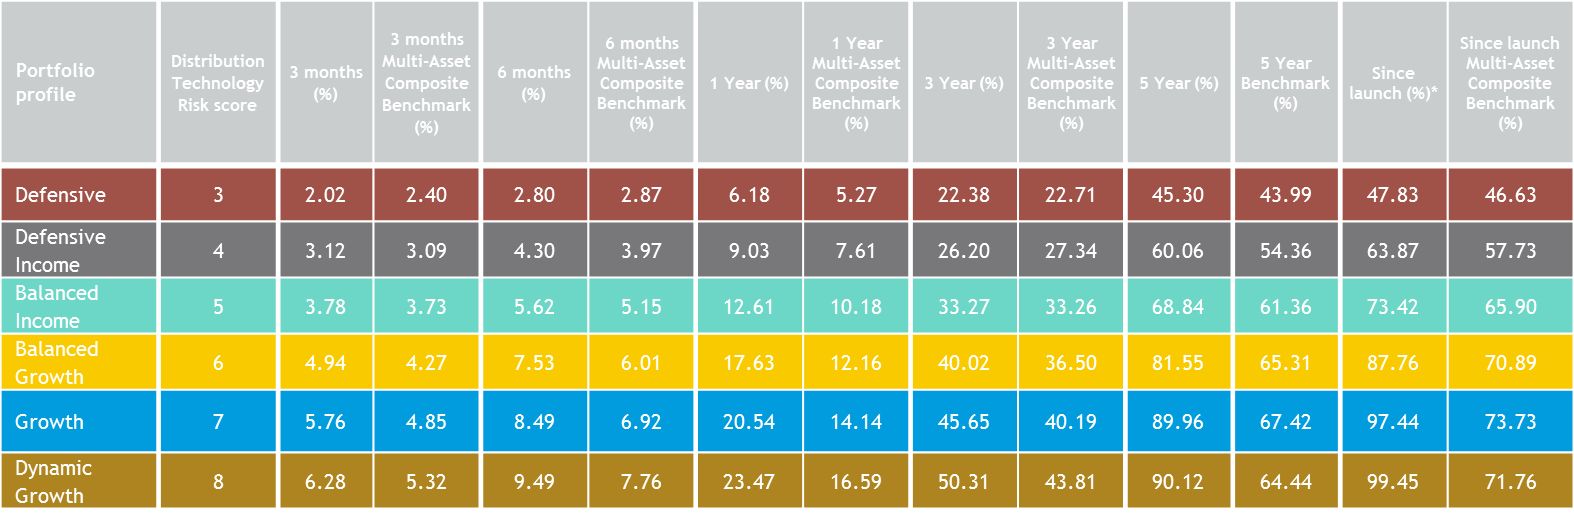
Data as at 31.12.17. Launch date 30.09.12. Benchmark: Smith & Williamson Multi-Asset Composite Benchmark
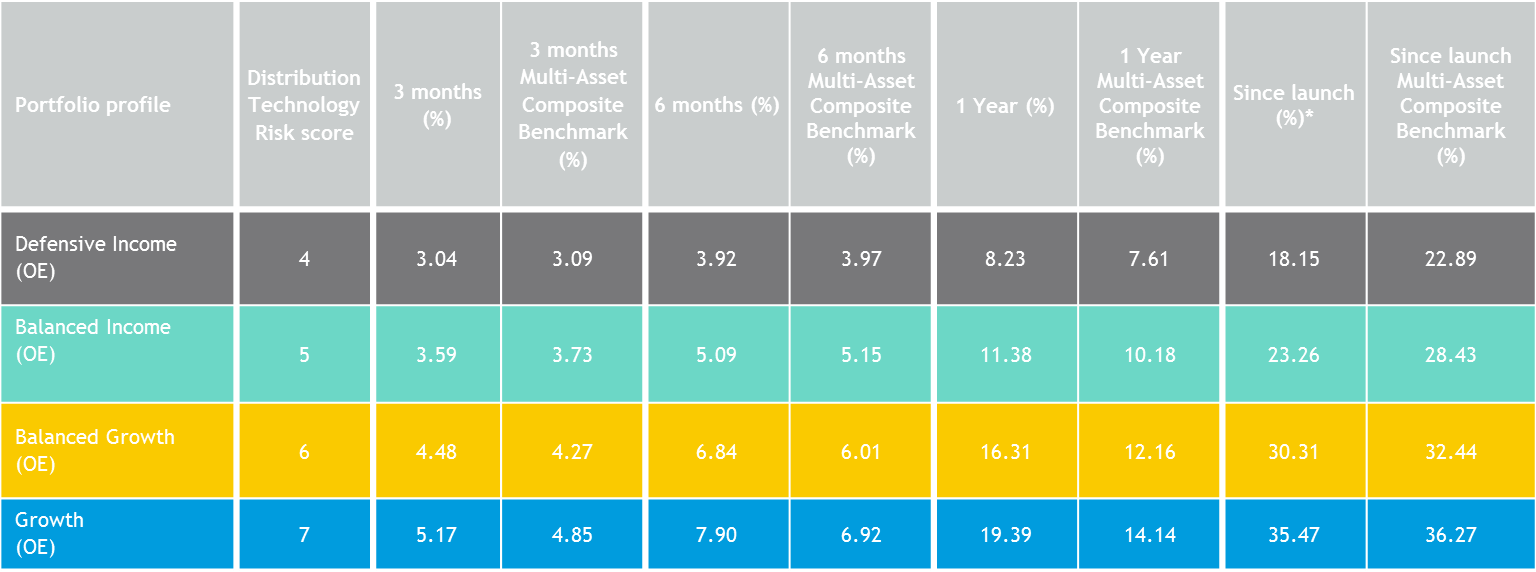
Data as at 31.12.17. Launch date 31.07.15. Benchmark: Smith & Williamson Multi-Asset Composite Benchmark.
In overseas developed equity markets, the stand out relative performance contributor was from our overweight allocation to Japan. Both our holdings here, Baillie Gifford Japan Trust and JPMorgan Japan, were significantly ahead of the index. Baillie Gifford Japan Trust rose by 47.3%, helped by its premium to NAV growing over the year despite the announcement that its long-standing manager Sarah Whitley will be retiring from Baillie Gifford in April 2018. In the US the strong conditions for technology companies helped Artemis US Extended Alpha add value, although for UK investors the rise in value of sterling versus the US dollar muted the returns from US stock markets in general.
In Europe we were less successful, although our overweight position was correct. Our stock selection (Argonaut European Alpha) did not add value until we switched into Blackrock European Dynamic in June. Exacerbating this was the significant portion of our exposure being hedged (as insurance against any political fallout in Europe) which meant we did not benefit from the euro’s strength and this position was only taken off in September once the most worrisome elections had been safely negotiated.
Emerging Markets were another key theme for the year, with economic indicators turning positive again after a period during which with resource and energy prices weak in 2015/16 had hampered GBP growth relative to developed markets. With the FTSE Emerging Markets index rising more than 21%, it was pleasing to see our core holdings in Hermes Global Emerging Markets and Fidelity Emerging Markets up 31.2% and 34.6% respectively. Our two individual country picks in this space however stole the limelight. Our big country call over the past couple of years has been an overweight to India and despite a more volatile period our holding in Goldman Sachs India rose by over 38%. Fidelity China Special Situations which has a bias to mid and small caps, as well as being geared, rose by 39.8%. The standout performer in our Asia allocation was our core position in Schroder Asian Total Return Investment Company which rose by 43.9% as compared to 20.3% from the FTSE Asia Pacific ex Japan index.
Our outlook for 2018 leads us to retain our preference for equities over bonds. 2017 earnings provided the bulk of global equity performance, not multiples, driven by increasing profit margins as wage growth has remained contained. We also expect a further boost from President Trump’s US tax reforms as expectations for US earnings are still relatively conservative. There is also no need for the central banks in the US, Europe, UK and Japan to tighten policy aggressively due to low inflation. We believe though that it will be important to look outside the UK for returns, most notably to Japan, Asia and Emerging Markets, as investor concerns from Labour’s policies (if they get into power) have downgraded UK growth expectations. The UK is also not that cheap relative to other major markets. The dollar is likely to remain weak for some time which will further boost Asia and Emerging Markets. We are conscious that various equity market records were set in 2017 and with the S&P in its second longest bull run in history we will need to remain vigilant.
All data as at 31 December 2017, sourced from Morningstar, FTSE and Thomson Reuters Datastream
The value of investments and the income from them can fall as well as rise and you may not receive back the original amount invested. Performance calculated net of underlying holding charges and platform fees and gross of Smith & Williamson fee. Including the Smith & Williamson fee will reduce returns. Past performance is not a guide to future performance.
DISCLAIMER
By necessity, this briefing can only provide a short overview and it is essential to seek professional advice before applying the contents of this article. This briefing does not constitute advice nor a recommendation relating to the acquisition or disposal of investments. No responsibility can be taken for any loss arising from action taken or refrained from on the basis of this publication. Details correct at time of writing.
This article was previously published on Smith & Williamson prior to the launch of Evelyn Partners.
Some of our Financial Services calls are recorded for regulatory and other purposes. Find out more about how we use your personal information in our privacy notice.
Please complete this form and let us know in ‘Your Comments’ below, which areas are of primary interest. One of our experts will then call you at a convenient time.
*Your personal data will be processed by Evelyn Partners to send you emails with News Events and services in accordance with our Privacy Policy. You can unsubscribe at any time.
Your form has been successfully submitted a member of our team will get back to you as soon as possible.
